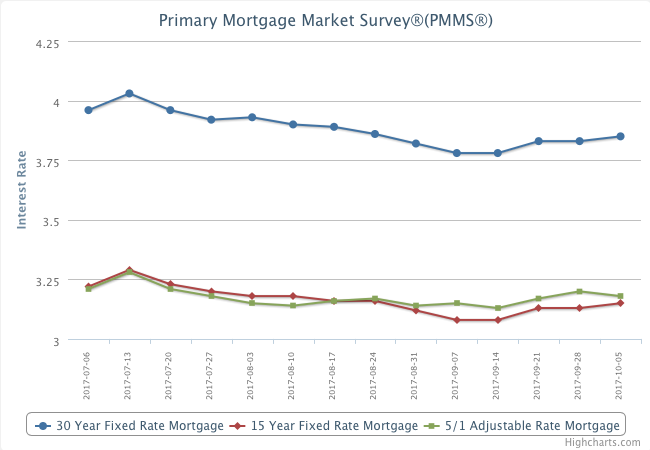
After holding steady last week, rates ticked up this week. The 10-year Treasury yield rose 8 basis points, while the 30-year mortgage rate increased 2 basis points to 3.85 percent.

After holding steady last week, rates ticked up this week. The 10-year Treasury yield rose 8 basis points, while the 30-year mortgage rate increased 2 basis points to 3.85 percent.

For Week Ending September 23, 2017
Last year’s national chorus was about how high buyer demand, a sunny economic outlook and enticingly low mortgage rates were propping up sales and prices in spite of low inventory. That refrain is still common enough, but regional changes continue to become more pronounced, whether due to weather, differing employment expectations or varying new construction outlooks. Let’s look at how our unique local market is performing.
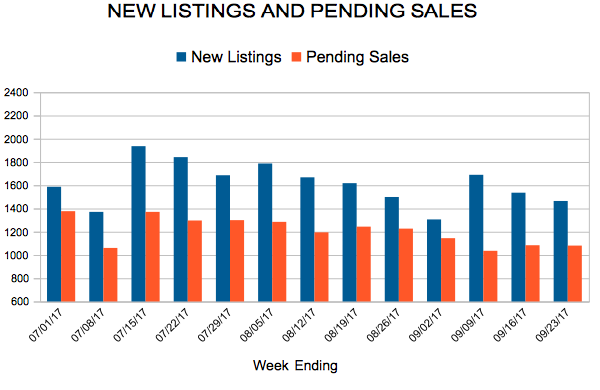
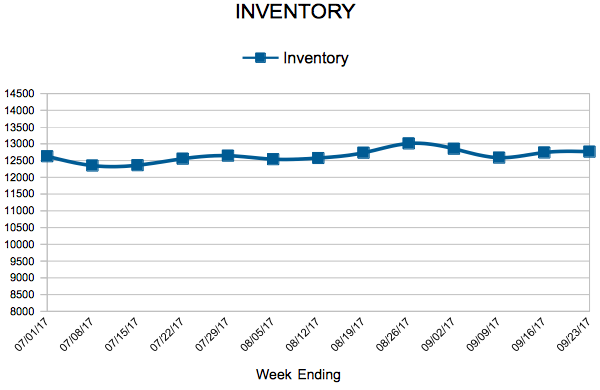
In the Twin Cities region, for the week ending September 23:
For the month of August:
All comparisons are to 2016
Click here for the full Weekly Market Activity Report. From The Skinny Blog.
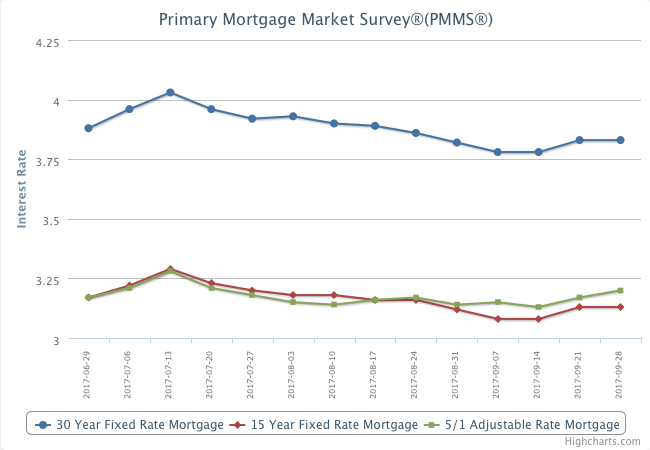
Rates held relatively flat this week. The 10-year Treasury yield fell just 1 basis point, while the 30-year mortgage rate remained unchanged at 3.83 percent.
For Week Ending September 16, 2017
According to the National Association of Home Builders, there is a rising demand in the new-home market spurred on by ongoing job and economic growth, the continuation of attractive mortgage rates and increased consumer confidence. And there does appear to be a notable increase in building or announced building projects around the country. Builder confidence tends to equate with more construction starts, which would be welcome news in an era of low inventory.
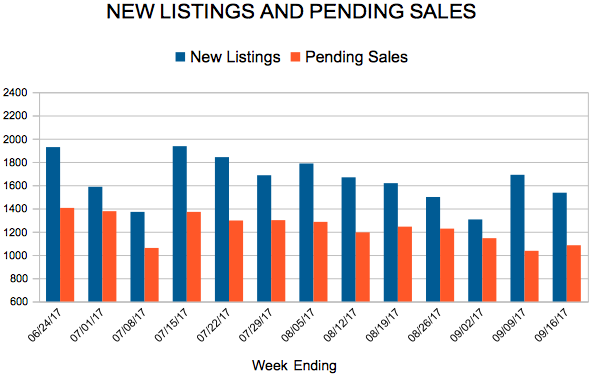
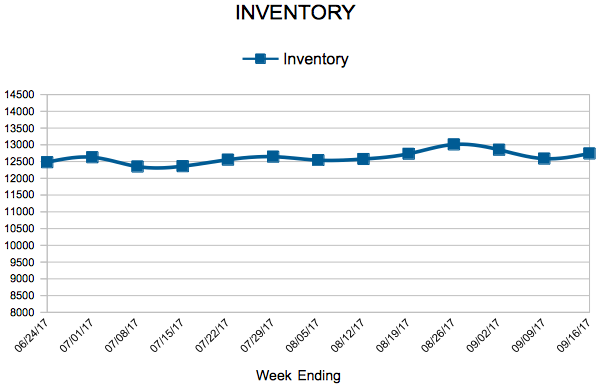
In the Twin Cities region, for the week ending September 16:
For the month of August:
All comparisons are to 2016
Click here for the full Weekly Market Activity Report. From The Skinny Blog.
“The fiercest competition will be on updated turn-key listings close to jobs and amenities.”
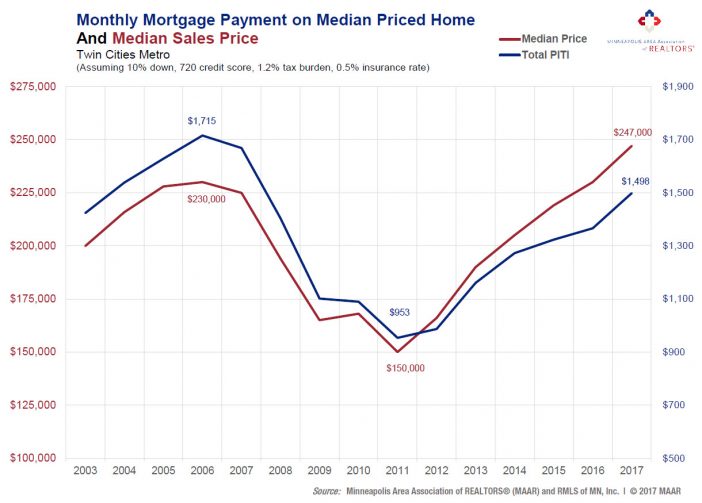
Since home prices for the Twin Cities metro have fully recovered and then some, it’s tempting (and even somewhat logical) to assume that monthly mortgage payments are also at all-time highs. That assumption would be entirely inaccurate. But it makes so much sense! If the median home price is at an all-time high, the monthly mortgage payment on that median priced home must therefore also be at an all-time high. Nope. Still false.
What this assumption fails to account for is of course mortgage or interest rates. The last time prices were this high, in 2006, the 30-year fixed mortgage rate was about 6.5 percent. In 2017, rates are averaging around 4.0 percent. That’s where this all-too-common assumption falls flat on its face.
The monthly payment on the median-priced home in 2006 was $1,715, but is only $1,498 in 2017, thanks to rates being 2.5 percentage points lower (6.5 vs 4.0). The median home price, however, has now reached $247,000 compared to $230,000 in 2006. So while affordability has declined since 2012, it still remains above 2004-2007 levels. In other words, despite prices being higher today than in 2006, monthly payments on purchased homes are still below where they were during the housing bubble.
From The Skinny Blog.