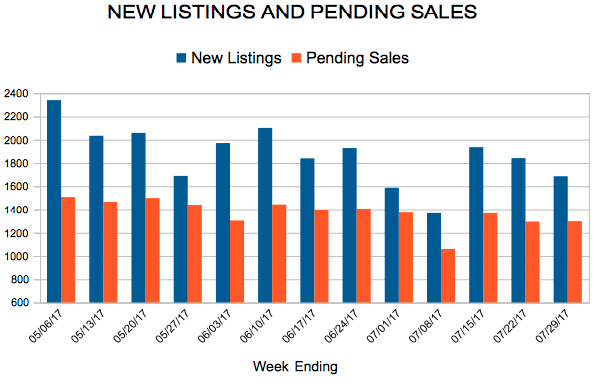
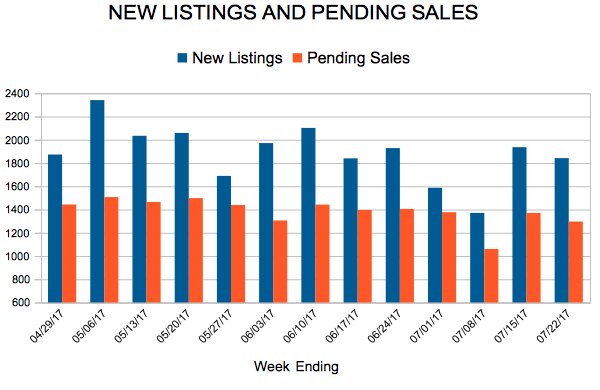
New Listings and Pending Sales


For Week Ending July 29, 2017
A favorable economy has kept buyers active amidst a summer of stiff competition that has led prices upward and often over the asking price. The latest recorded national unemployment rate of 4.3 is historically low and has served as a general indicator of a strong economy. If wage growth shifts into overdrive from its current state of patient increases, we may see even higher prices or, conversely, more willingness by sellers to increase the inventory pool.
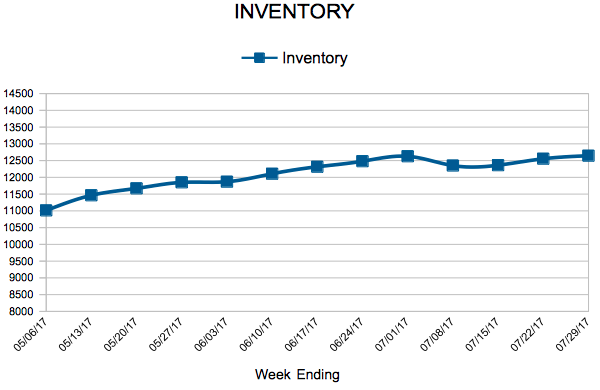
In the Twin Cities region, for the week ending July 29:
For the month of June:
All comparisons are to 2016
Click here for the full Weekly Market Activity Report. From The Skinny Blog.
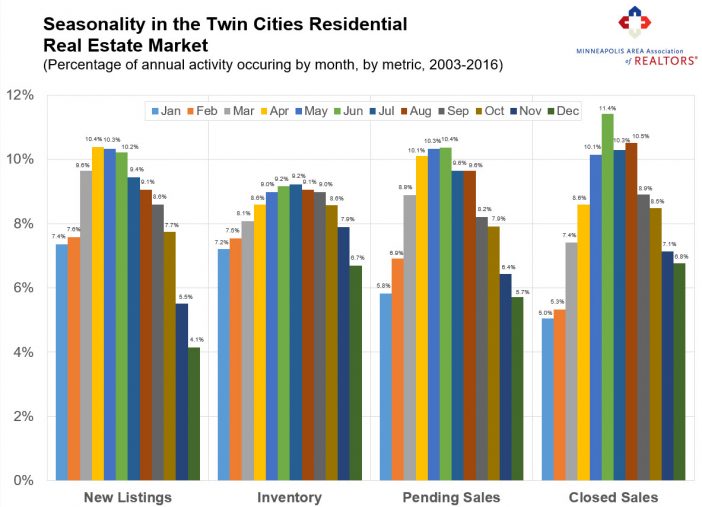
Given the fact that the school year is about a month away (yikes) and we’ve already had our first preview of fall weather, it feels like a good time to talk about seasonality. First of all, whatever you do, don’t use the term “seasonably adjusted.” Second of all, don’t make matters worse by talking about the “seasonably adjusted medium sales price.” That’s not a thing.
All kidding aside, both agents and the public have a vested interested in knowing how and when listings, inventory levels, purchase agreements and closed sales ebb and flow throughout the year. Ever been asked the question or wondered “when do the most new listings come on the market?” Or “when do buyers write the most offers?” Or how about “what month tends to have the greatest number of homes for sale?”
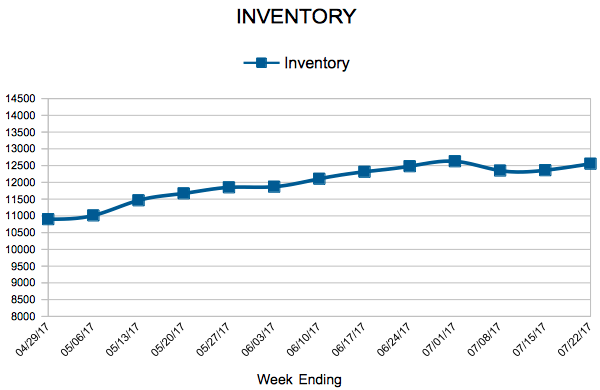
These are legitimate and important questions that can inform a variety of market-related strategies. Technically, April sees the highest volume of new listings, but buyers have the greatest number of choices in July. Signed purchase agreements peak in June along with closed sales. The shape of the seasonal curves can also be revealing. Seller activity tends to ramp up quickly in March and April and then quiet down rapidly starting in October. New listings are front-loaded in the first half of the year. Buyer activity, particularly pending sales, tends to follow more of a “normal” or even distribution throughout the year.
From The Skinny Blog.
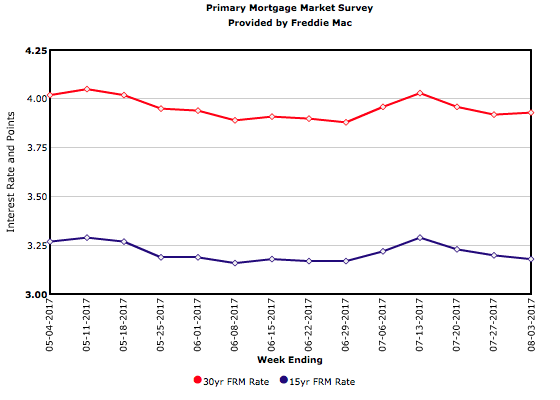
The 10-year Treasury yield was relatively flat this week, as was the 30-year mortgage rate which rose 1 basis point to 3.93 percent. Despite a strong advance estimate for second quarter GDP, markets are erring on the side of caution.
For Week Ending July 22, 2017
Residential real estate activity has remained robust through the summer months so far. New listing and sales activity may not always land exactly where desired or expected from week to week, but it is clear by gradually increasing prices and ongoing low inventory that buyer demand has not weakened.
In the Twin Cities region, for the week ending July 22:
For the month of June:
All comparisons are to 2016
Click here for the full Weekly Market Activity Report. From The Skinny Blog.
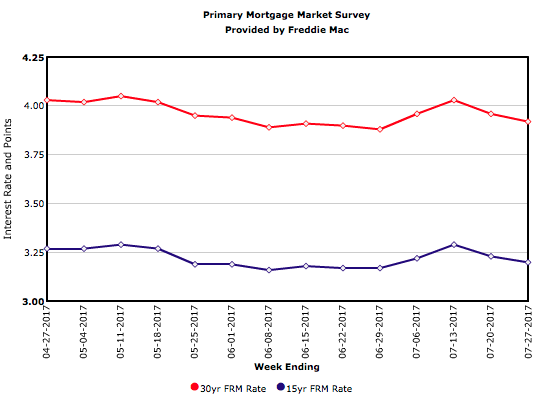
The 10-year Treasury yield rose 5 basis points this week while the 30-year mortgage rate dropped 4 basis points to 3.92 percent.
