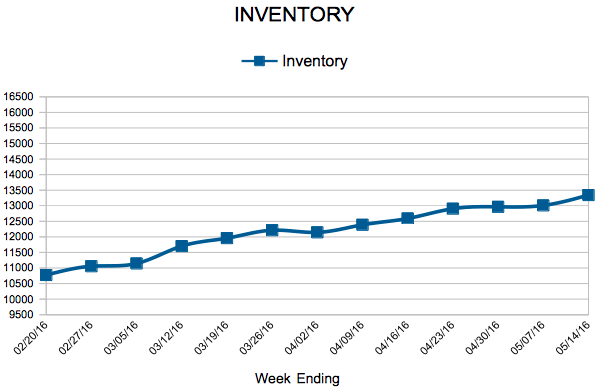
Inventory


For Week Ending May 14, 2016
The U.S. housing market continues to churn out positive year-over-year sales numbers, but some markers of hesitation are worth watching. Some sellers hesitate to list their homes because they are not sure that they will find an attractive replacement for their own fast-selling home. Many young consumers, saddled with student loan debt and having transient tendencies, hesitate to commit to a home purchase longer than previous generations. Nevertheless, home starts are on the rise, and the market remains strong during the busiest weeks of the year.
In the Twin Cities region, for the week ending May 14:
For the month of April:
All comparisons are to 2015
Click here for the full Weekly Market Activity Report. From The Skinny Blog.
By Aubray Erhardt on Tuesday, May 17th, 2016
New Listings showed a second year-over-year decline in 2016 while pending purchase activity rose for the 17th straight month. Buyers signed 6,373 new purchase agreements, a small but important 1.6 percent gain compared to a record-setting April 2015. Due to the well-known supply shortages in our market, would-be sellers are concerned about their ability to secure their next property in the current environment. Inventory levels fell 19.4 percent to 12,849 active properties. Because of record demand, weak supply and a more expensive mix of homes selling, the April median sales price rose 7.7 percent to $231,500. Median list price, by contrast, has already reached and exceeded its previous record, perhaps an indication that the median sales price could do the same this year.
As was the case in March, serious buyers came out swinging in April. In fact, sellers had the same chance of getting offers above their current list price as they did below. Those odds were exactly fifty-fifty—as they were in 2005. That’s not the case for original list price, which indicates that once a home is properly priced, serious buyers are willing to write full-price offers. Unsurprisingly, homes tended to sell in less time, with cumulative days on market declining 14.1 percent to 73 days. That’s the lowest April figure since 2007. Months supply of inventory fell 27.8 percent to 2.6 months—the lowest April figure on record going back to 2003. Generally, five to six months of supply is considered a balanced market. While our region as a whole is favoring sellers, not all areas, segments or price points necessarily reflect that.
“This is an important milestone that speaks to the health of our market,” said Judy Shields, Minneapolis Area Association of REALTORS® (MAAR) President. “Sellers should not interpret this to mean they are guaranteed offers above their list price. Every price range, area and segment is still unique. It’s more important now than ever to properly price your home. This means buyers–particularly those in multiple offers–should be ready to make full price offers on the properties that best fits their needs.”
The last time absorption rates, consumer demand and home prices were where they are today, the median percent of current list price received at sale was also 100.0 percent, so this isn’t entirely unfamiliar territory. There was also significantly more inventory in 2004 and 2005. The marketplace is finally closing the gap from the recession before advancing—sustained by smarter lending policy, job and wage increases, population growth, the risk of higher interest rates and relentlessly rising rents. It’s worth noting that traditional sales tend to fetch a higher ratio of sales price to list price. For the first April since 2007, traditional sales made up over 90.0 percent of overall sales, which boosts the percentage of current list price received.
The national unemployment rate for April was unchanged at 5.0 percent. With a local unemployment rate of 4.0 percent, the Minneapolis-St.Paul-Bloomington metropolitan area was among the top ten large metros with the lowest unemployment rate. The 30-year fixed mortgage rate continued to hover just above 3.6 percent compared to a long-term average of about 8.0 percent. Rates took a surprising dive after the Federal Reserve announced the first hike last year. Marginally higher rates were widely expected in 2016, even though a June rate hike seems unlikely.
“The economy is still strengthening and the market is very competitive,” said Cotty Lowry, MAAR President-Elect. “Serious buyers must be prepared to make strong offers right away or risk not having their offer accepted.”
From The Skinny Blog.
For Week Ending May 7, 2016
Although higher than they were a year ago, mortgage applications are barely moving from week to week despite mortgage rates sitting at three-year lows. Supply remains lean across the country, and sales figures are showing some of the strain of that reality. Homes that show well continue to sell quickly and at prices that make sellers smile.
In the Twin Cities region, for the week ending May 7:
For the month of April:
All comparisons are to 2015
Click here for the full Weekly Market Activity Report. From The Skinny Blog.
For Week Ending April 30, 2016
The home-purchasing season may get a bit competitive this year thanks to low mortgage rates and pent up demand. With pending sales on the rise in many markets combined with a relatively low number of homes for sale, buyers need to act quickly once they find their ideal home.
In the Twin Cities region, for the week ending April 30:
For the month of April:
All comparisons are to 2015
Click here for the full Weekly Market Activity Report. From The Skinny Blog.
For Week Ending April 23, 2016
Despite the literal and symbolic rain on the real estate market’s parade recently, REALTORS® are keeping busy with closing finalizations and stacked showing schedules. The average days on market remains low in most price ranges across the country. Interested buyers, and their agents, have to move fast this spring in order to find the right fit.
In the Twin Cities region, for the week ending April 23:
For the month of March:
All comparisons are to 2015
Click here for the full Weekly Market Activity Report. From The Skinny Blog.
So from the standpoint of a family or individual in the midst of a local decision-making process, national data is more or less worthless. Worse, it can actually lead to negative outcomes if a local decision was made based on national figures. Perhaps a Case-Shiller report showed that home prices are rising across their 20-city composite index. But that doesn’t mean prices are rising in every neighborhood or city, or even a particular section of a neighborhood. However, when it comes to bench-marking how we’re doing in Minnesota against other states, national-scale market data can play a marginally useful role.
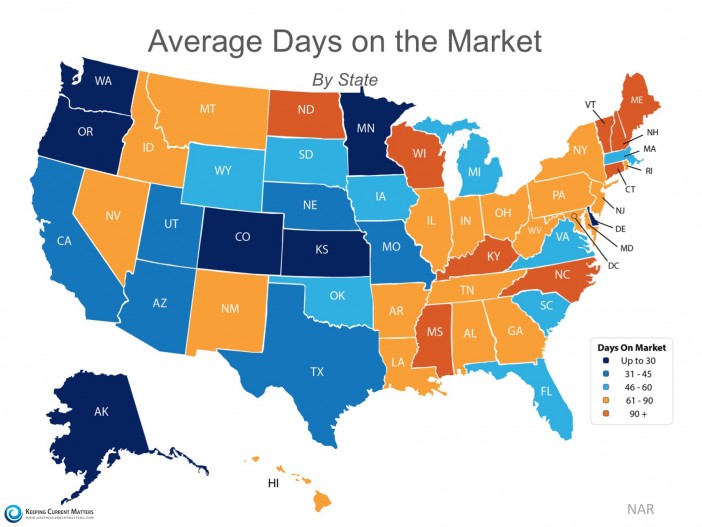
The folks at Keeping Current Matters (KCM) have taken information from NAR’s Monthly REALTOR® Confidence Survey to generate a heat map showing hot spots and cold spots around the country. The darkest blue represents states where homes sell quickly (30 days and under). The darkest orange represents states where homes tend to sell in over 90 days.
As you can see (and as most agents know), Minnesota homes tend to sell quickly. Our state is in the top quintile, among a group of only five other states. It’s a safe bet that our acute inventory shortage plays a large role in this dynamic, but our extremely competitive labor market, attractive business climate, affordable housing stock, high quality of life, diversity, top-notch schools and our treasured parks and water bodies also play a big role in attracting and keeping people here. That translates into strong demand for housing, which—when combined with very low supply levels—means homes tend to sell pretty quickly.