For Week Ending December 18, 2021
Single-family rents increased 10.9% year-over-year as of last measure, the fastest year-over-year increase in more than 16 years, and more than 3 times the rate of increase a year earlier, according to the CoreLogic Single-Family Rent Index (SFRI). Vacancy rates are at a 25-year low, as demand for rental units has surged this year due to skyrocketing sales prices and low inventory in the residential housing sector, leading some aspiring buyers to rent while waiting for the market to moderate.
IN THE TWIN CITIES REGION, FOR THE WEEK ENDING DECEMBER 18:
- New Listings decreased 23.5% to 565
- Pending Sales decreased 18.5% to 787
- Inventory decreased 20.8% to 5,543
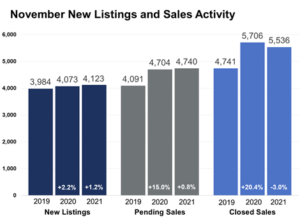
FOR THE MONTH OF NOVEMBER:
- Median Sales Price increased 9.6% to $339,625
- Days on Market decreased 11.8% to 30
- Percent of Original List Price Received decreased 0.4% to 99.8%
- Months Supply of Homes For Sale decreased 21.4% to 1.1
All comparisons are to 2020
Click here for the full Weekly Market Activity Report. From MAAR Market Data News.