For Week Ending March 15, 2025
The U.S. homeownership rate remain largely unchanged in the fourth quarter of 2024, ticking up 0.1% from the third quarter to 65.7%, according to a recent report from Realtor®.com. Homeownership rates remained between 65.6% and 65.7% last year, down from Q2 2020’s high of 67.9%, but higher than pre-pandemic years. The homeowner vacancy rate increased 0.1% from the previous quarter to 1.1%, while the rental vacancy rate remained the same, at 6.9%.
IN THE TWIN CITIES REGION, FOR THE WEEK ENDING MARCH 15:
- New Listings increased 4.1% to 1,408
- Pending Sales decreased 1.1% to 927
- Inventory increased 1.3% to 7,487
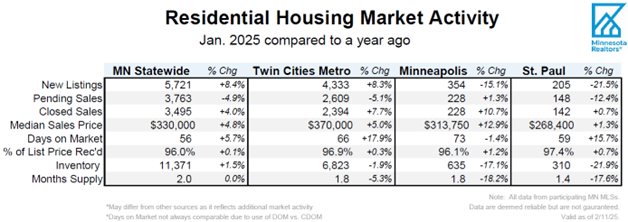
FOR THE MONTH OF FEBRUARY:
- Median Sales Price increased 6.1% to $380,000
- Days on Market increased 16.9% to 69
- Percent of Original List Price Received increased 0.2% to 97.7%
- Months Supply of Homes For Sale increased 5.3% to 2.0
All comparisons are to 2024
Click here for the full Weekly Market Activity Report. From MAAR Market Data News.