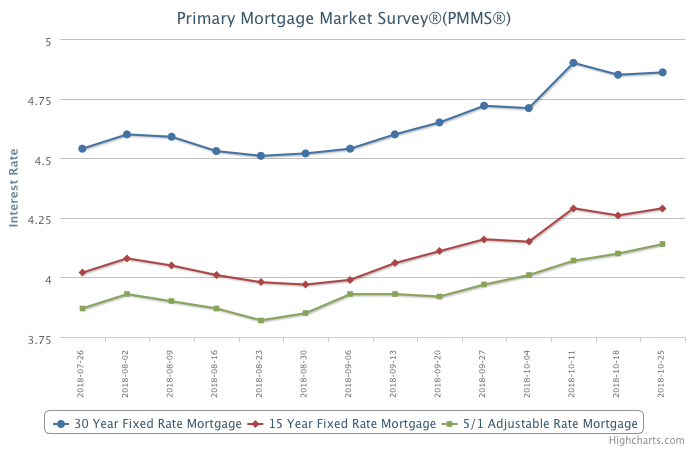
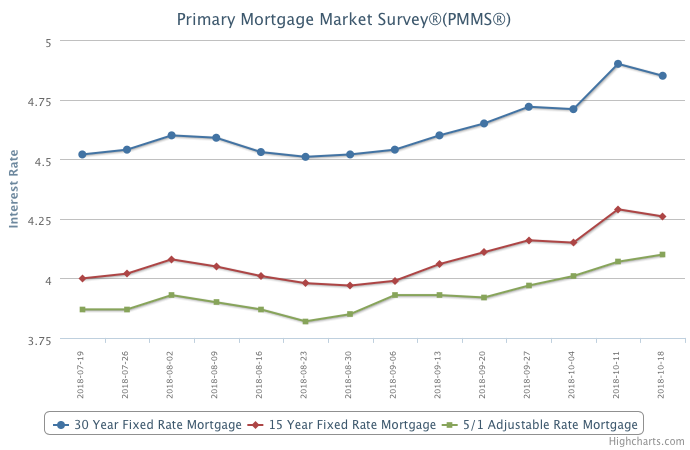
Weekly Market Report

For Week Ending September 15, 2018
The kids are tucked into schools, harvest festivals and fall equinox parties are underway, and residential real estate markets are entering a new season with strong fundamentals and healthy levels of activity. While it is sensible to monitor reputable news sources that report on housing with respectable statistics to back claims, it is also important to stay grounded in the reality that we continue to enjoy a prosperous time in real estate.
In the Twin Cities region, for the week ending September 15:
- New Listings increased 19.5% to 1,836
- Pending Sales increased 4.8% to 1,195
- Inventory decreased 6.3% to 12,475
For the month of August:
- Median Sales Price increased 6.3% to $268,000
- Days on Market decreased 16.7% to 40
- Percent of Original List Price Received increased 0.7% to 99.2%
- Months Supply of Inventory decreased 3.8% to 2.5
All comparisons are to 2017
Click here for the full Weekly Market Activity Report. From The Skinny Blog.
Existing Home Sales
Mortgage Rates Move Up Again

The 30-year fixed-rate mortgage increased once again to its highest level since May.
Mortgage rates are drifting upward again and represent continued affordability challenges for prospective buyers – especially first-time buyers. Borrowing costs are moving right now for three main reasons: the very strong economy, higher U.S. government debt issuances and global trade tensions.
Information provided by Freddie Mac.
Gung-Ho Sellers Post Largest Increase in Nearly Three Years
More sellers are feeling optimistic about listing their homes just as humidity, cabin weekends and food-on-a-stick give way to rakes, school buses and sweater vests. Compared to last August, Twin Cities sellers listed 7.6 percent more homes on the market. That was the largest increase since late-2015. Although buyers signed 2.9 percent fewer contracts than last year, they did manage to close on slightly more deals. Three of the last four months had increases in new listings; three of the last four months had decreases in pending sales. This trend of rising seller activity and moderating buyer activity suggests we could be approaching those long-awaited inventory gains. Sure enough, the 7.8 percent decline was the smallest decrease in inventory in over three years. Months supply was down just 3.8 percent to 2.5 months.
That said, today’s buyers still face plenty of competition over limited supply. Sellers yielded an average of 99.2 percent of their original list price and 100.1 percent of their current list price, illustrating how drastically undersupplied markets tend to favor sellers. The shortage is especially noticeable at the entry-level prices, where multiple offers and homes selling for over list price have become commonplace. The move-up and upper-bracket segments are less competitive and—for the most part—much better supplied. The market remains relatively tight, but there are some early signs that things could be loosening up for buyers.
August 2018 by the Numbers (compared to a year ago)
• Sellers listed 7,814 properties on the market, a 7.6 percent increase
• Buyers closed on 6,629 homes, a 0.2 percent increase from last August
• Inventory levels for August fell 7.8 percent compared to 2017 to 12,243 units
• Months Supply of Inventory was down 3.8 percent to 2.5 months
• The Median Sales Price rose 6.3 percent to $268,000, a record high for August
• Cumulative Days on Market declined 16.7 percent to 40 days, on average (median of 21)
• Changes in Sales activity varied by market segment
o Single family sales fell 0.8 percent; condo sales rose 15.3 percent; townhome sales increased 1.1 percent
o Traditional sales rose 1.5 percent; foreclosure sales sank 35.4 percent; short sales dropped 31.3 percent
o Previously-owned sales were down 0.5 percent; new construction sales increased 20.9 percent
New Listings and Pending Sales
Inventory
Weekly Market Report

For Week Ending September 8, 2018
Changing demographics, income levels, corporate growth and natural disasters all affect residential real estate markets. Home prices in Seattle and San Francisco have increased amidst e-commerce and technology success stories, while listings and sales decline precipitously when a hurricane strikes. This week, we are reminded of the destruction delivered by Hurricane Harvey to Houston at this time last year. From Katrina to Sandy to Maria to Florence, housing markets have bent but remain unbroken.
In the Twin Cities region, for the week ending September 8:
- New Listings increased 3.8% to 1,755
- Pending Sales decreased 2.3% to 1,048
- Inventory decreased 7.2% to 12,213
For the month of August:
- Median Sales Price increased 6.3% to $268,000
- Days on Market decreased 16.7% to 40
- Percent of Original List Price Received increased 0.7% to 99.2%
- Months Supply of Inventory decreased 3.8% to 2.5
All comparisons are to 2017
Click here for the full Weekly Market Activity Report. From The Skinny Blog.
Mortgage Rates Rise for Third Straight Week

The one-two punch of strong job and consumer credit growth drove mortgage rates up to their highest mark since August 2.
Mortgage rates are currently 0.82 percent higher than a year ago, which is the biggest year-over-year increase since May 2014. Looking ahead, annualized comparisons for mortgage applications may look weaker than they appear, but that’s primarily because of the large spread between mortgage rates now and last September, which was when they reached their low for the year.
Overall, this spectacular stretch of solid job gains and low unemployment should help keep homebuyer interest elevated. However, mortgage rates will likely also move up, as the Federal Reserve considers short-term rate hikes this month and at future meetings.
Information provided by Freddie Mac.
New Listings and Pending Sales
- « Previous Page
- 1
- …
- 78
- 79
- 80
- 81
- 82
- …
- 151
- Next Page »