Inventory


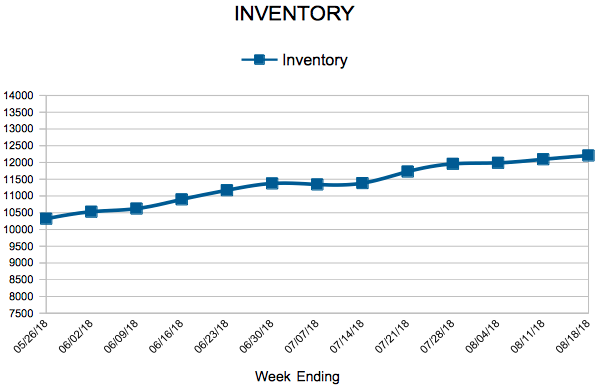
For Week Ending August 18, 2018
It has been another busy summer for residential real estate. The lower supply, higher prices, faster sales mantra has remained in place for most of the nation for the entirety of the year – which heightened in intensity during the summer sales season – but there has been some conversation about the possibility of more supply and lower prices. Presently, it is just conversation, as the numbers are not reflective of a shift in trend lines anytime soon.
In the Twin Cities region, for the week ending August 18:
For the month of July:
Click here for the full Weekly Market Activity Report. From The Skinny Blog.
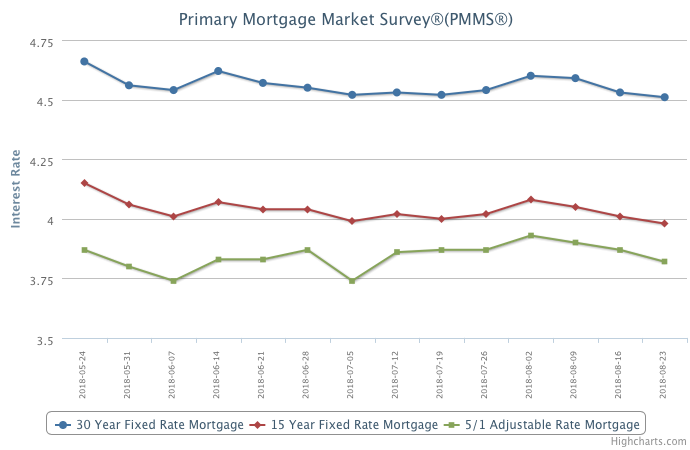
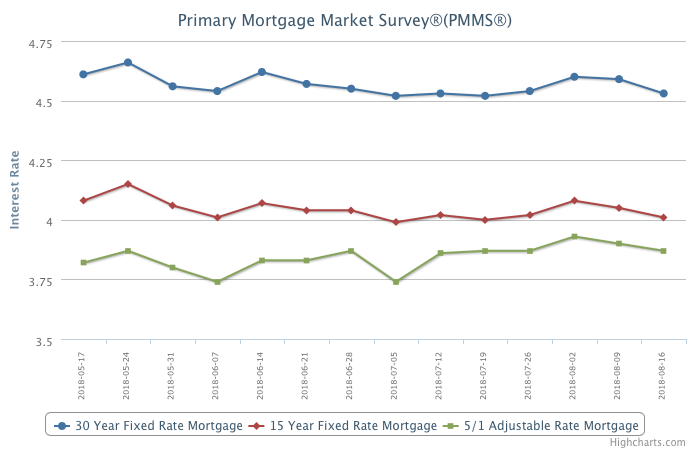
Mortgage rates inched backward this week to their lowest level since mid-April.
Backed by very strong consumer spending, the economy is red-hot this month, which is in turn rippling through the financial markets and driving equities higher.
Unfortunately, the same cannot be said about the housing market, where it appears sales activity crested in late 2017. Existing-home sales have now stepped back annually for the fifth straight month, and purchase mortgage applications this week were barely above year ago levels.
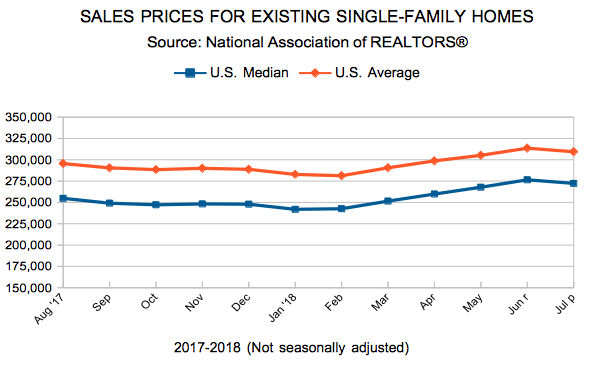
“The chatter about housing price bubbles have increased this summer as observers attempt to predict the next shift in the residential real estate market.”

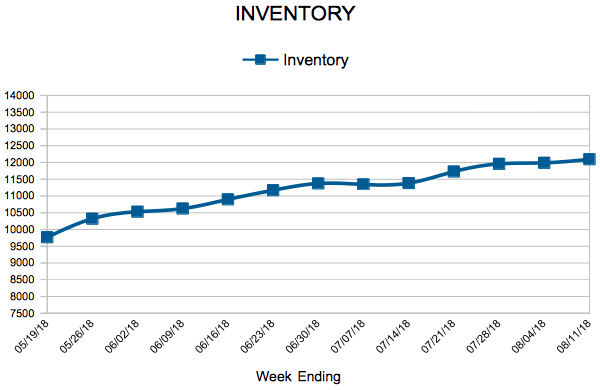
For Week Ending August 11, 2018
The U.S. housing market is becoming a tale of regions. Consumers in high-priced markets in the West are pushing back with fewer showings and sales. The Midwest is marked mostly by stability of new listings and sales with gently improving inventory. Many Northeast markets have routinely struggled to keep pace with the overall U.S. economic recovery. And the South is enjoying more showings and sales than the rest of the nation. Here’s what’s happening in the local market.
In the Twin Cities region, for the week ending August 11:
For the month of July:
All comparisons are to 2017
Click here for the full Weekly Market Activity Report. From The Skinny Blog.
By David Arbit on Thursday, August 16th, 2018
New listings increased this July compared to last year, which could hint at a flurry of sellers looking to take advantage of this strong market. July marked the second increase in seller activity since November 2017. Meanwhile, buyer activity flattened out after seven months of year-over-year declines. This trend of rising seller activity and moderating buyer activity could mean more inventory coming down the pipeline. Increasing seller activity combined with a cool-down in demand is consistent with a loosening marketplace. That said, buyers shopping this summer and fall will still face stiff competition. Cooling buyer activity is likely a reflection of the shortage of homes for sale. Sellers yielded an average of 99.8 percent of their original list price and 100.6 percent of their current list price, illustrating how undersupplied markets tend to favor those with something to sell. The shortage is especially noticeable at the entry-level prices, where multiple offers and homes selling for over list price have become increasingly common. The move-up and upper-bracket segments are less competitive and better supplied. The market remains relatively tight, but there are some early signs that things could be loosening up to provide relief to buyers.
July 2018 by the Numbers (compared to a year ago)
Sellers listed 7,671 properties on the market, a 4.1 percent increase
Buyers closed on 6,242 homes, almost dead-even with last July
Inventory levels for July fell 13.5 percent compared to 2017 to 11,709 units
Months Supply of Inventory was down 11.1 percent to 2.4 months
The Median Sales Price rose 6.6 percent to $268,000, a record high for July
Cumulative Days on Market declined 17.4 percent to 38 days, on average (median of 18)
Changes in Sales activity varied by market segment
Single family sales fell 1.8 percent; condo sales rose 13.4 percent; townhome sales increased 5.2 percent
Traditional sales rose 1.2 percent; foreclosure sales sank 39.3 percent; short sales dropped 23.3 percent
Previously-owned sales were even with last year; new construction sales increased 14.0 percent
Mortgage rates remained mostly flat over the past week, which has been the dominant theme since late spring.
This stability in borrowing costs comes despite the highest core inflation rates since 2008 and turbulence in the currency markets. Unfortunately, this pause in rates is not leading to increasing home sales.
Purchase mortgage applications trailed year ago levels again last week, and it’s clear in some markets that the combination of ascending home prices, limited affordable inventory and this year’s higher rates are curtailing homebuyer demand.