For Week Ending April 29, 2017
Much of the news surrounding the housing market is about climbing prices and continued decreases in inventory on a year-over-year basis. Although prices have been rising steadily, we are only now beginning to reach pre-recession price levels on a national basis, and that’s not the rule for all homes and communities. If demand stays strong, unemployment rates continue to dwindle and wages keep consumer confidence high, the market should remain active and interesting.
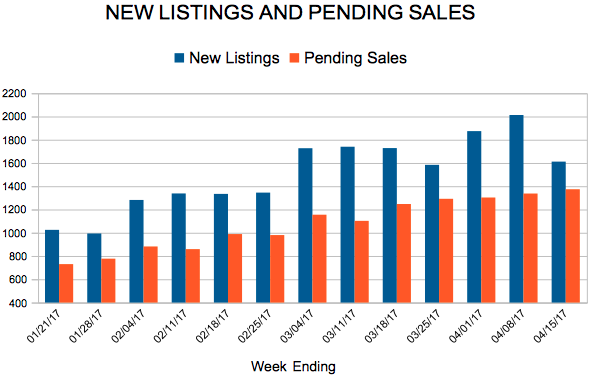
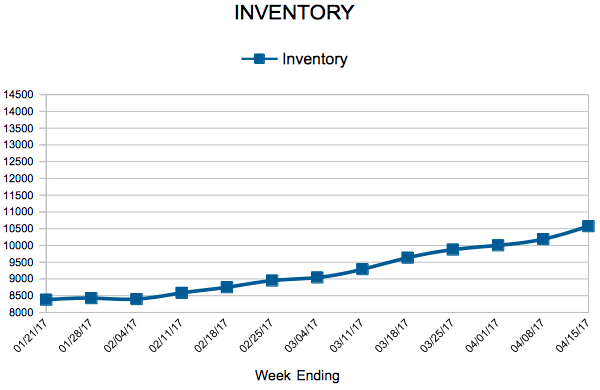
In the Twin Cities region, for the week ending April 29:
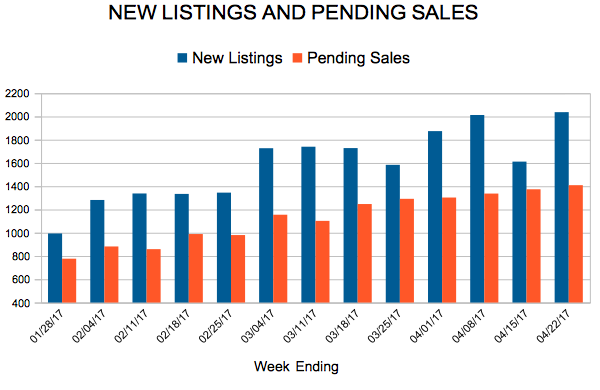
- New Listings increased 0.1% to 1,873
- Pending Sales decreased 9.6% to 1,443
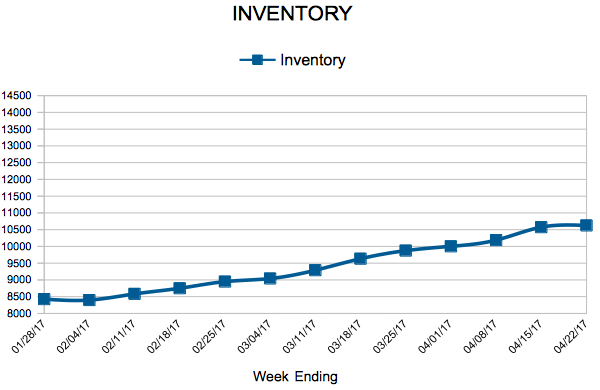
- Inventory decreased 19.8% to 10,901
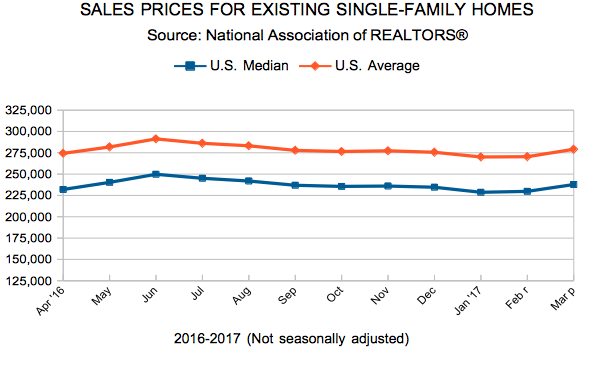
For the month of March:
- Median Sales Price increased 6.9% to $237,400
- Days on Market decreased 15.3% to 72
- Percent of Original List Price Received increased 1.3% to 98.1%
- Months Supply of Inventory decreased 19.2% to 2.1
All comparisons are to 2016
Click here for the full Weekly Market Activity Report. From The Skinny Blog.