For Week Ending July 30, 2016
It’s only August, but this time during summer usually means making plans for changes ahead, especially the start of a new school year. For potential home buyers with school-aged children, these are the pivotal days for deciding whether or not to purchase or wait. With inventory as low as it is, we are in a place where big moves will be made or saved for later, and sales figures will reflect as much.
In the Twin Cities region, for the week ending July 30:
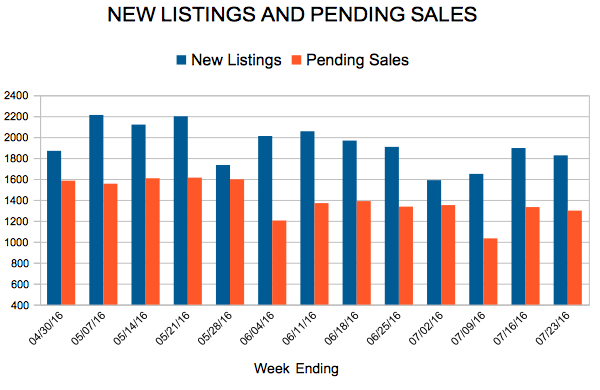
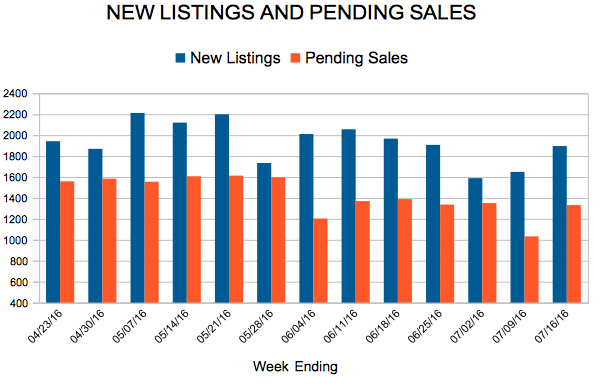
- New Listings increased 3.3% to 1,723
- Pending Sales decreased 4.6% to 1,289
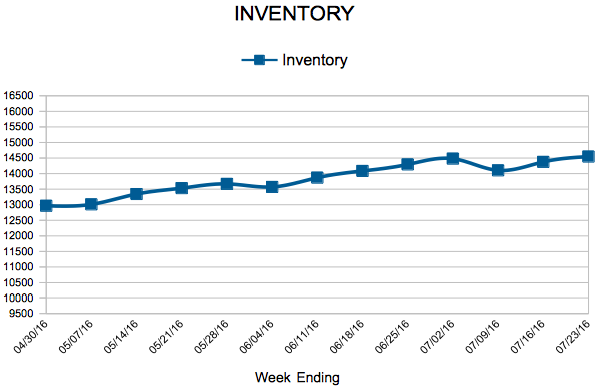
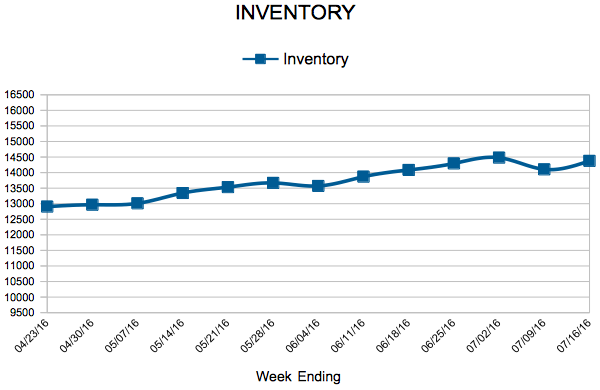
- Inventory decreased 18.0% to 14,588
For the month of July:
- Median Sales Price increased 6.6% to $239,900
- Days on Market decreased 15.9% to 53
- Percent of Original List Price Received increased 0.8% to 98.4%
- Months Supply of Inventory decreased 23.7% to 2.9
All comparisons are to 2015
Click here for the full Weekly Market Activity Report. From The Skinny Blog.