August 19, 2019
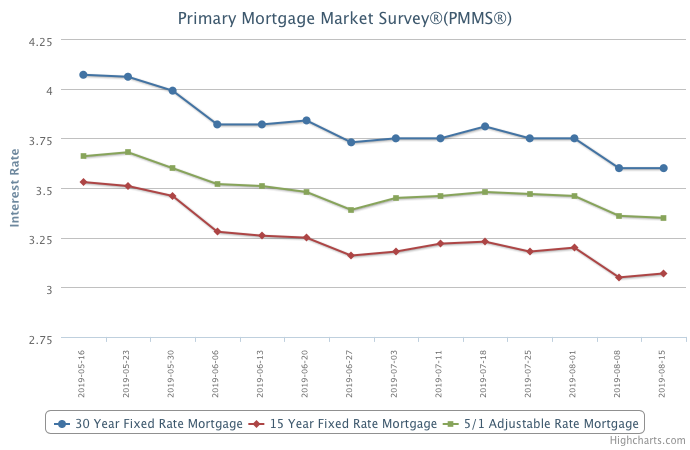
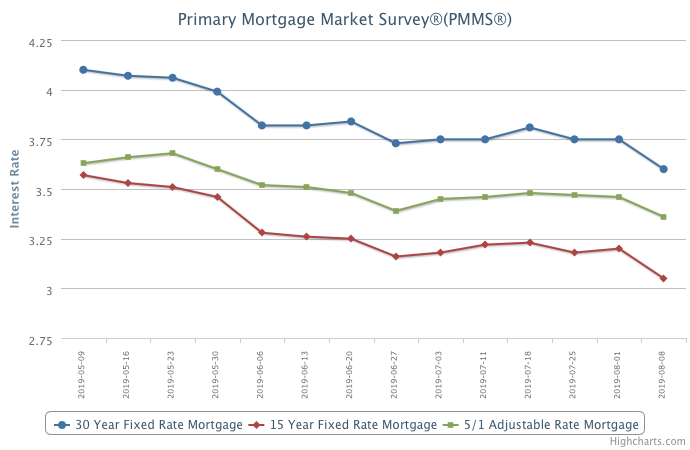
The current economic expansion recently became the longest on record, but it’s showing its age. Concerns around slowing growth have spiked amidst new economic data and gyrations in equity markets, but it’s also created opportunities for home buyers. The upside is that mortgage rates have fallen yet again as investors flock to the safety of longer-term U.S. government bonds, thereby driving down the 10-year treasury yield and the 30-year mortgage rates that follow it. That means markets expect monetary easing and lower interest rates to spur growth in the short-term. The risk of recession has grown, but the economy is still buzzing along at a decent pace. Buying a home is an emotional decision, and buyers sometimes pull back at any whiff of turbulence out of fear of hardship.
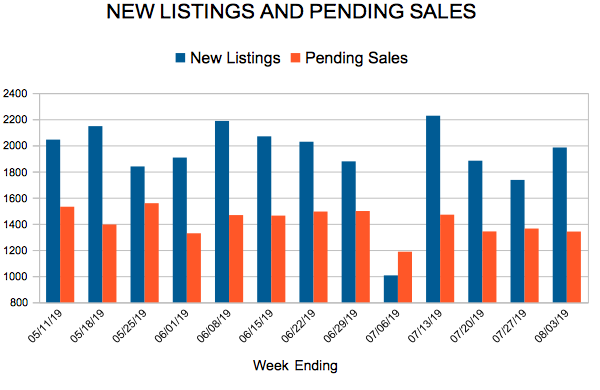
Twin Cities home buyers and sellers, however, did not pull back in July. Sales rose 4.5 percent and sellers even listed almost 2.0 percent more product than last July. Despite lower interest rates and modest inventory gains as tailwinds, the persistent shortage of homes on the market and affordability headwinds remain. Price increases and wage gains are more aligned now than in the past, but investors are still competing with millennial first-time buyers in the already competitive under $300,000 segment. Conversely, there’s some evidence of a slow-down in the luxury segment. Metrics to watch aside from sales and prices include market times, the ratio of sold to list price and months of supply. These three indicators could be hinting at potential market shifts ahead. That said, home price declines are unlikely until absorption rates rise above 6 months. We’re currently at 2.4 months.
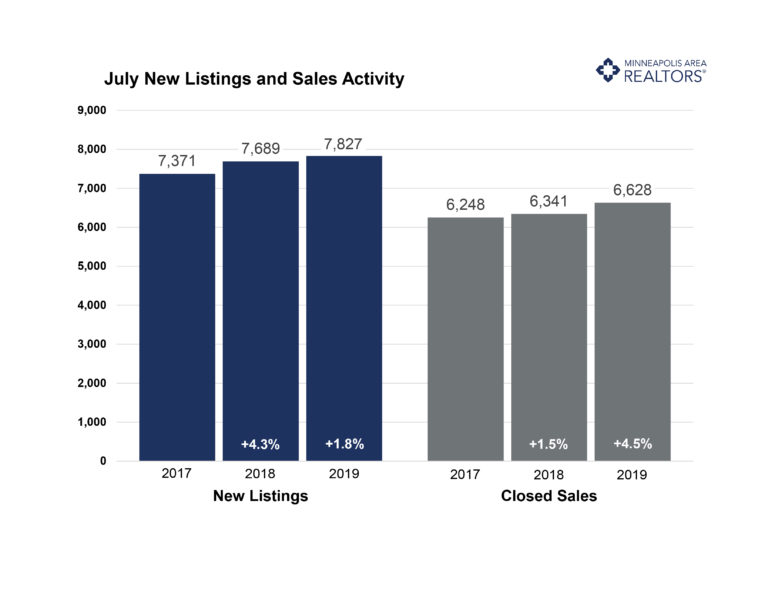
July 2019 by the Numbers (compared to a year ago)
- Sellers listed 7,827 properties on the market, a 1.8 percent increase from last July
- Buyers closed on 6,628 homes, a 4.5 percent increase
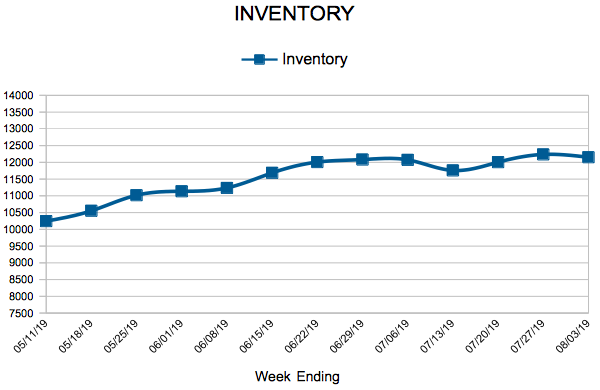
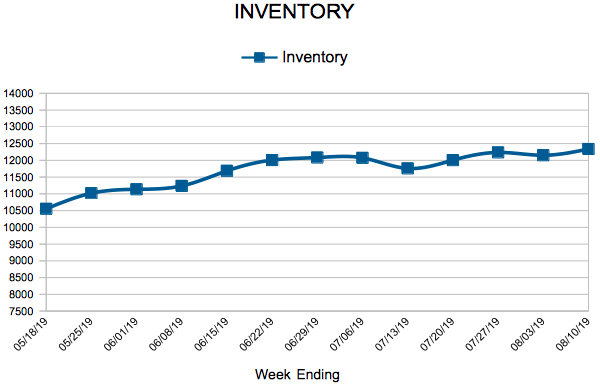
- Inventory levels decreased 4.4 percent from last July to 11,961 units
- Months Supply of Inventory was down 4.0 percent to4 months
- The Median Sales Price rose 5.9 percent to $283,700, a record high for July
- Cumulative Days on Market remained stable at 38 days, on average (median of 18)
- Changes in Sales activity varied by market segment
-
- Single family sales rallied 6.0 percent; condo sales increased 2.2 percent; townhome sales rose 0.8 percent
- Traditional sales increased 5.6 percent; foreclosure sales dropped 17.6 percent; short sales fell 37.5 percent
- Previously owned sales were up 5.6 percent; new construction sales rose 4.5 percent
Quotables
“There are lots of headlines out there vying for our attention,” said Todd Urbanski, President of Minneapolis Area REALTORS®. “The bottom line is that the best time to buy a home is when you’re ready. Over 70.0 percent of Minnesotans have made that choice, the vast majority of whom have seen their values increase.”
“No one thought mortgage rates would touch 3.6 percent again,” said Linda Rogers, President-Elect of Minneapolis Area REALTORS®. “Buyers who felt squeezed by a monthly mortgage payment should take another look and consider this a fleeting gift.”
From The Skinny Blog.
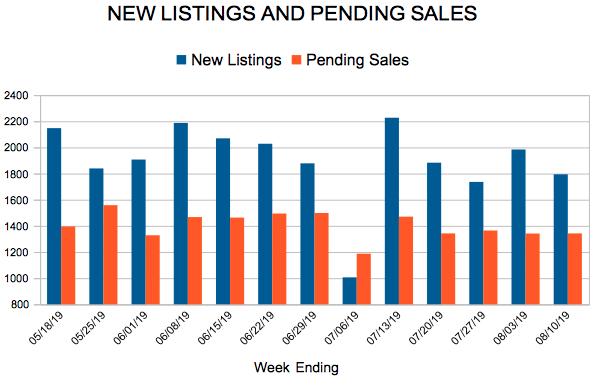
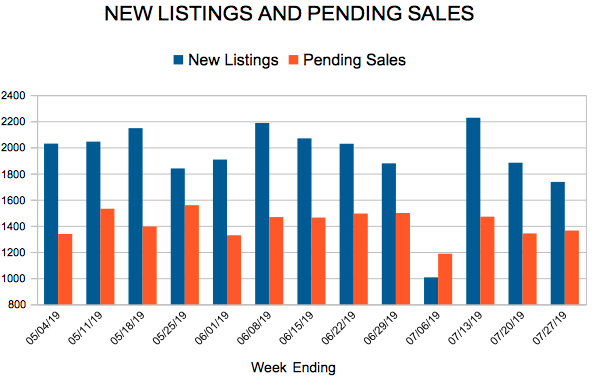
 For Week Ending August 10, 2019